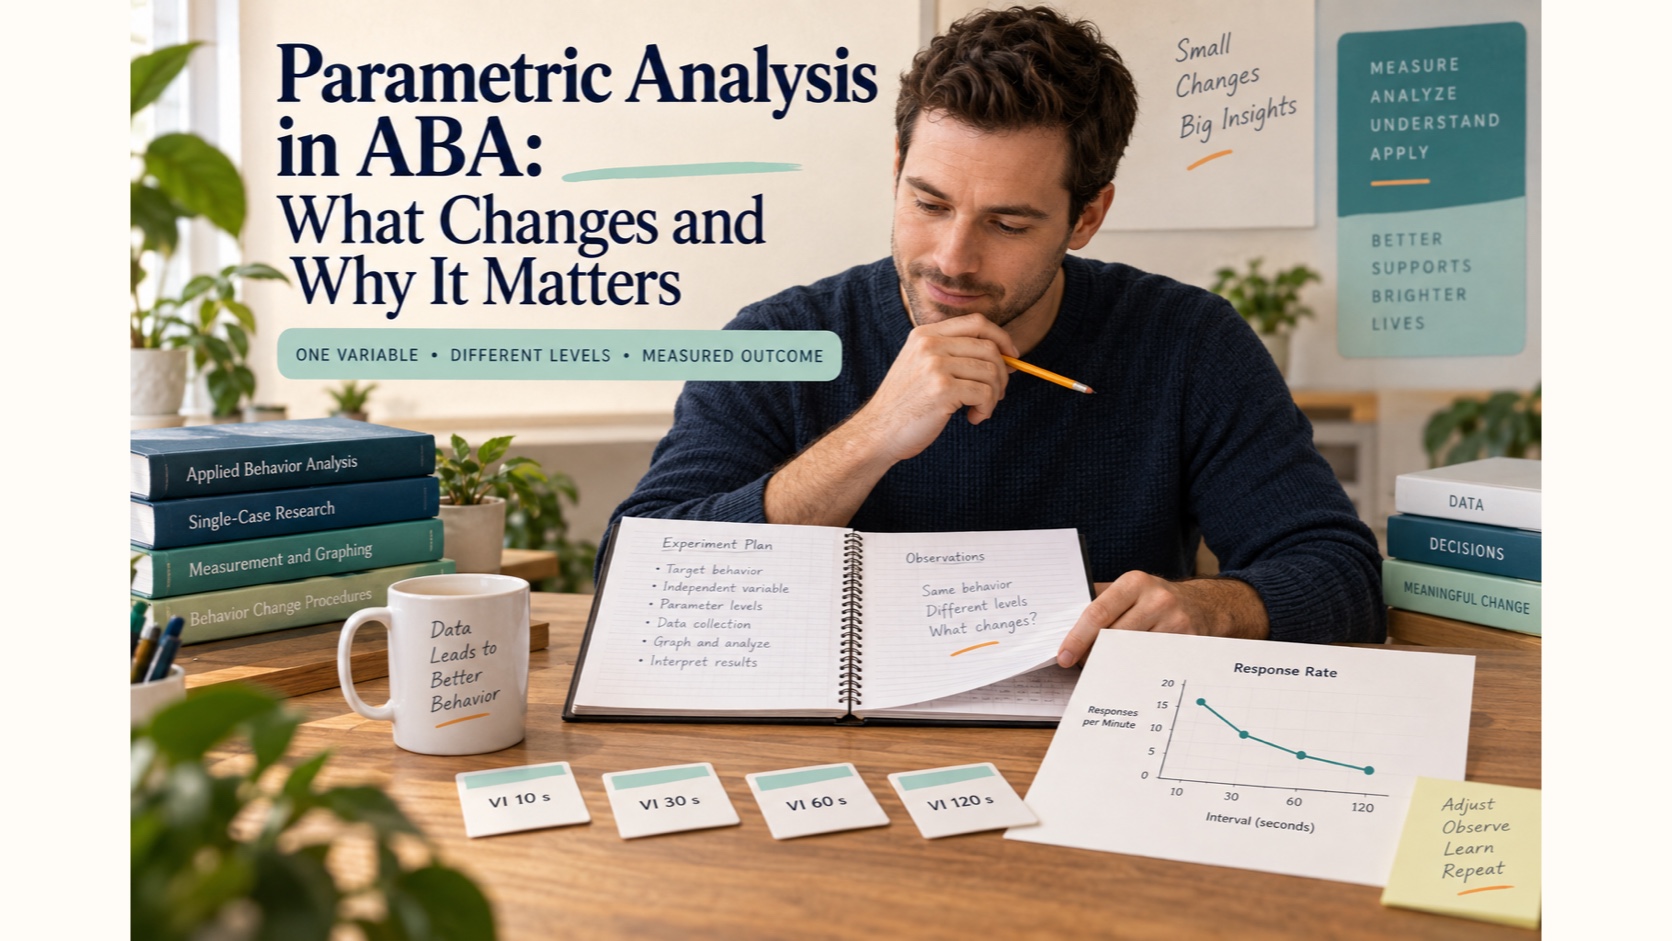
Parametric Analysis in ABA: What Changes and Why It Matters
Parametric analysis in ABA is a way to study different values of one independent variable and observe how responding changes. The question is not simply, “Did the intervention work?” It is closer to, “What happens when this one feature is delivered at several planned levels?”
The phrase can be confusing because “parametric” also appears in statistics. In behavior analysis, parametric analysis refers to an experimental question about the values or intensity of a variable. It is not the same as choosing a parametric statistical test. This guide connects the term to the BCBA and BCaBA experimental-design outlines and uses a simple learning example to make the distinction usable.
Quick answer: a parametric analysis changes the level of one independent-variable dimension—such as delay, duration, amount, rate, or number of opportunities—across planned conditions while measuring a defined outcome. It helps describe how responding changes across values. The goal may be to identify a useful range, a trend, or a value that balances effectiveness with effort, but it does not produce a universal best number for every learner or setting.
Where the concept appears in ABA study outlines
In the current BCBA Test Content Outline (6th ed.), Domain D is Experimental Design. D.8 asks candidates to identify rationales for conducting comparative, component, and parametric analyses. The BCaBA Test Content Outline (6th ed.) places the same family of distinctions in D.6, which asks candidates to distinguish and implement them. These outline references tell you that the concept is part of experimental-design reasoning, not merely a vocabulary definition.
For study, keep two levels separate. At the first level, you should recognize the question type in a vignette. At the second level, you should explain why changing a parameter could be useful and what evidence would be needed to interpret the result. The second level is where many short glossary definitions become too thin.
Parametric, comparative, and component analysis
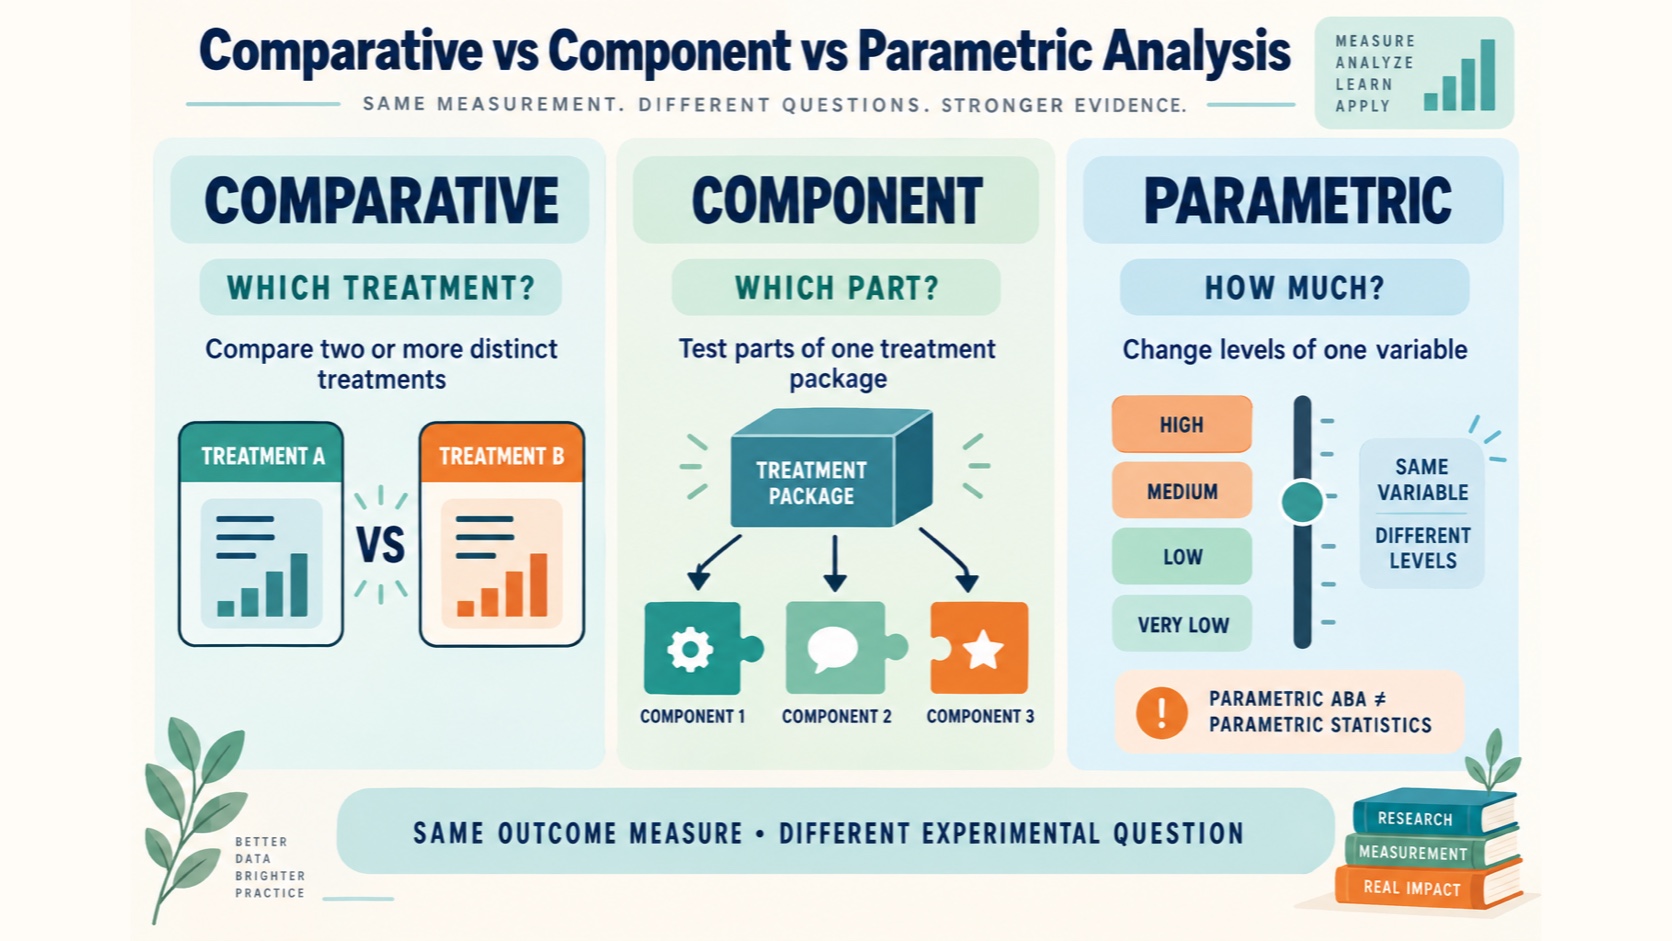
These three terms can appear together because they answer different versions of “what works?”
- Comparative analysis: compares two or more distinct treatments or intervention packages. The question is, “Which treatment produces the more useful outcome under these conditions?”
- Component analysis: examines the parts of a treatment package. The question is, “Which element is necessary, sufficient, or contributing to the observed change?”
- Parametric analysis: changes the value of one dimension of a variable. The question is, “How does the outcome change when this feature is delivered at different levels?”
Here is a quick way to see the difference. Comparing a visual schedule with a task checklist is a comparative question because the treatments are different. Comparing a package with a visual schedule plus a model against the same package without the model is a component question because one part changes. Comparing two, four, and six practice opportunities while keeping the teaching package the same is a parametric question because the amount of one feature changes.
The labels describe the experimental question, not the appearance of the graph. A multiple-element arrangement might be used in more than one type of analysis. The design and the manipulated variable work together, but one should not be used as a substitute for the other.
A simple parameter example
Imagine a hypothetical study of a learner practicing a short independent response. The team wants to understand whether the delay between an instruction and a prompt changes independent responding. They plan three values: a short delay, a medium delay, and a longer delay. The response measure is the percentage of opportunities completed independently. The question is not whether prompting exists; prompting is present across conditions. The question is how the planned delay value changes performance.
To make the comparison meaningful, the team would define the response, describe each delay precisely, use the same opportunity definition, and record the outcome consistently. They would also attend to procedural integrity: if the “longer delay” condition is implemented inconsistently, a different result could reflect implementation error rather than the parameter itself.
Suppose independence is low at the shortest delay, rises at the middle delay, and becomes variable at the longest delay. That pattern may suggest a useful range for further discussion, but it does not prove that the middle value is universally best. The result belongs to the learner, materials, staff, timing, and conditions studied. A different environment could produce a different relation.
This example can also be written with other parameters: the amount of reinforcement, the duration of a practice block, the number of opportunities, the time between prompts, or the density of a schedule. The important feature is not the topic word. It is the deliberate change in one dimension with a defined outcome.
What must be planned and measured
A parametric question becomes easier to reason through when the plan answers five questions:
- What is the independent variable? Name the feature that changes, not the whole treatment package.
- What are the parameter values? Describe each level in observable, measurable terms.
- What remains as stable as practical? Hold other important procedure features steady enough that the value comparison remains interpretable.
- What is the dependent variable? Choose a measure that captures the behavior dimension relevant to the question, such as independent responses, errors, latency, or duration.
- What decision will the data inform? Decide in advance whether you are looking for a trend, a feasible range, an efficiency trade-off, or a need for more assessment.
That last question matters because more is not automatically better. A higher amount, longer duration, or denser schedule may change behavior while also increasing effort, time, cost, or implementation burden. A useful parametric analysis considers both the behavior-change outcome and the practical conditions under which the procedure could be delivered.
In applied work, the person receiving services and the people implementing the plan are not just measurement units. Preferences, dignity, context, feasibility, safety, and social validity shape whether a parameter is reasonable to study. A graph can show a difference while the plan still requires revision because the condition is not acceptable or sustainable.
How to interpret the pattern
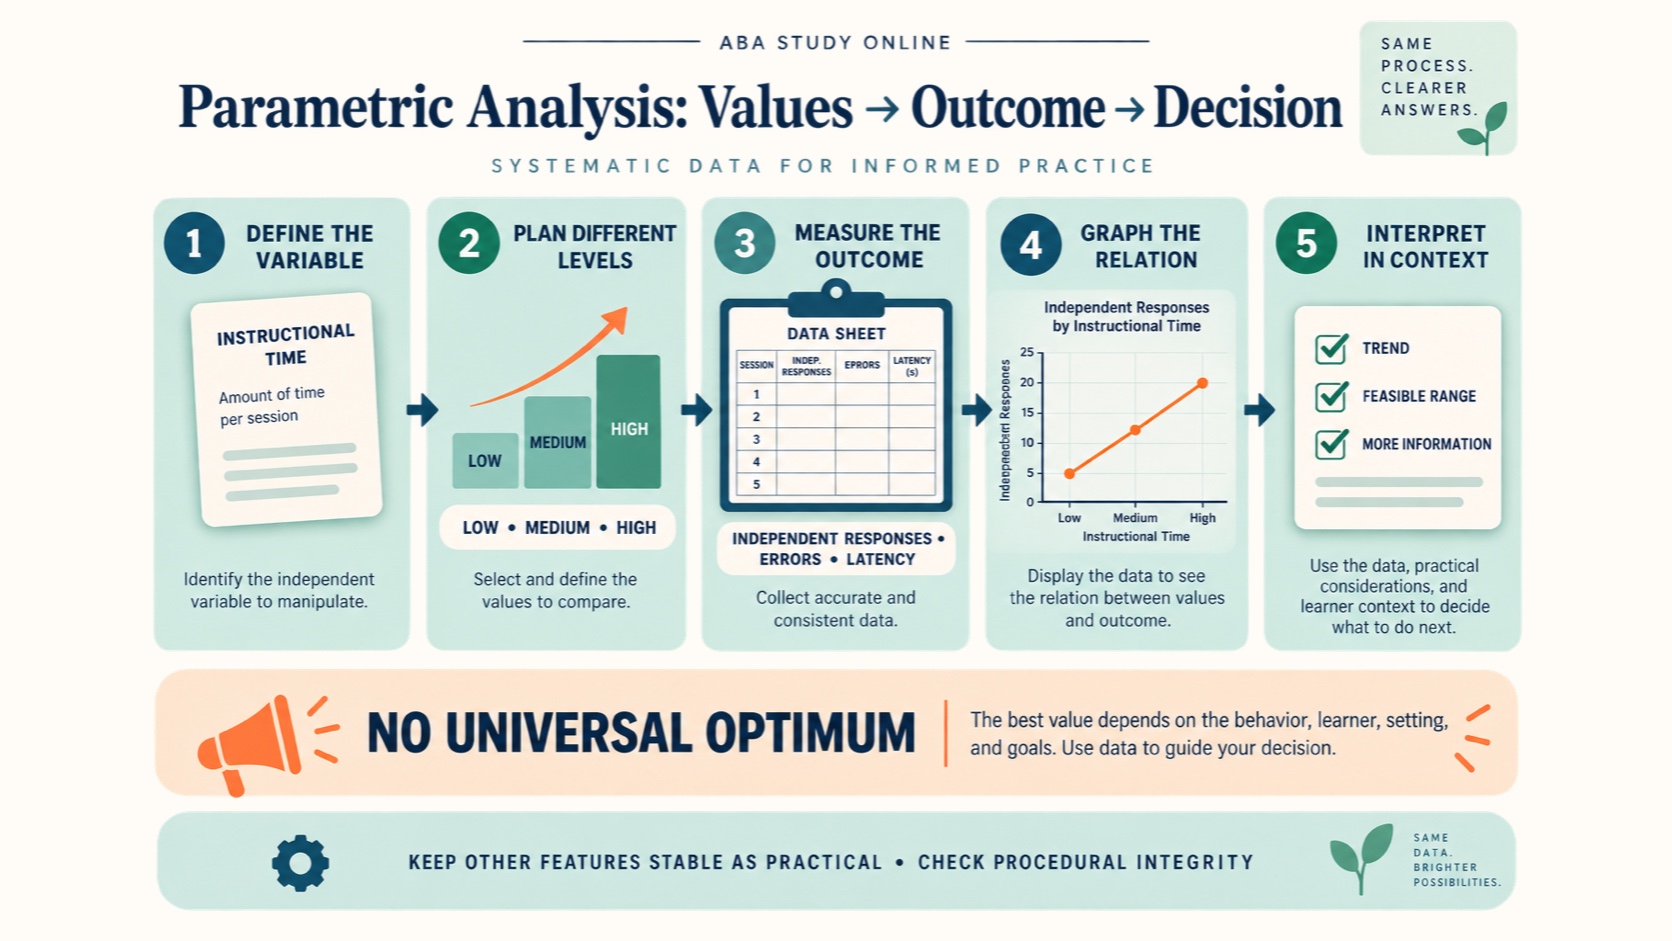
Look at the relation across values, not only at the highest single data point. A pattern may be increasing, decreasing, flat, threshold-like, or curvilinear. You also need to ask whether the data are stable enough, whether the levels were implemented accurately, and whether order, carryover, or learning effects could have influenced the result.
Do not turn a small study into a universal rule. A parametric result can support a provisional operating range, a decision to adjust a procedure, or a decision to collect more information. It is part of an evidence-based process, not a magic calculator that outputs one correct intensity.
For an exam vignette, name the variable that changes. If the answer choices differ by treatment, think comparative. If one option adds or removes a piece of a package, think component. If the same feature appears at several amounts or levels, think parametric. Then check what outcome the question asks you to interpret.
Common mistakes
- Confusing the term with parametric statistics: in ABA experimental design, the term describes varying a parameter of an independent variable.
- Changing the entire intervention: if the whole treatment changes, the question may be comparative rather than parametric.
- Removing a treatment element: that is the logic of a component analysis, not simply a different dose of one feature.
- Changing several dimensions at once: if amount, timing, and delivery format all change, you may not know which parameter explains the outcome.
- Choosing the largest value automatically: effectiveness must be interpreted with effort, feasibility, integrity, and social validity.
- Ignoring procedural integrity: inconsistent delivery makes it harder to attribute a pattern to the parameter.
- Calling one graph a universal prescription: applied findings are interpreted in context and monitored over time.
How to study the concept
Make a three-row note card:
- Comparative: which treatment?
- Component: which part?
- Parametric: how much or which level?
Then create your own neutral vignette and underline the phrase that identifies the manipulation. If the prompt says the analyst compares 5, 10, and 15 seconds of the same delay, identify the delay as the parameter. If it says the analyst removes the visual schedule from a package, identify the component question. If it says the analyst compares a visual schedule with a checklist, identify the comparative question.
Use the ABA Theory Blocks to review experimental-design vocabulary, free ABA questions to practice identifying the manipulated variable, and the ABA Definition Search to compare related terms. A simple ABC Data Sheet can help you practice separating observation from interpretation, but it does not replace a research design or clinical review.
Parametric analysis in ABA FAQ
What is a parametric analysis in ABA?
It compares different values or levels of one independent-variable dimension while measuring a defined outcome. The purpose is to understand the relation across values and support a context-specific decision.
How is parametric analysis different from component analysis?
A component analysis examines parts of a treatment package. A parametric analysis keeps the feature conceptually the same and varies its amount, intensity, timing, or another dimension.
Is parametric analysis the same as parametric statistics?
No. The ABA concept describes an experimental comparison of parameter values. Parametric statistics are a separate statistical-method question.
Does a parametric analysis always find an optimal value?
No. It may show a trend, a range, a flat relation, or a need for more information. Any decision remains tied to the learner, procedure, data quality, and context studied.
Where does this appear on the BCBA exam outline?
In the BCBA 6th-edition outline, D.8 asks candidates to identify rationales for comparative, component, and parametric analyses. The BCaBA 6th-edition outline includes the distinction in D.6.